05. Mean
Mean
What exactly does the mean value represent in a Gaussian distribution? The mean value is the center of the bell curve.
Take a look at the visualization below. Staying with the San Francisco temperature example, it shows three distributions with three different means. Everything else stays the same including the standard deviation.
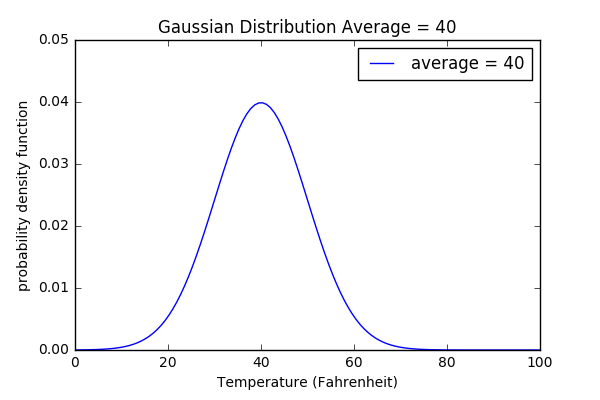
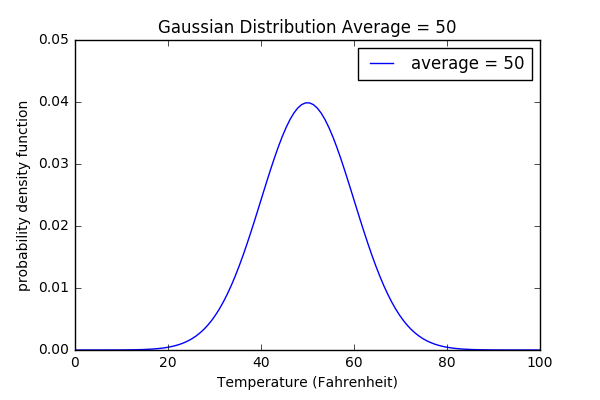
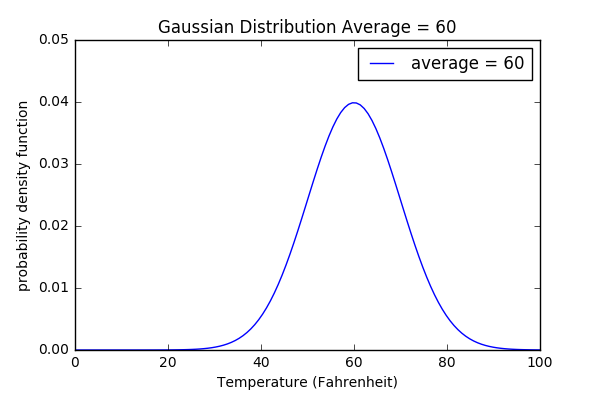
You can see that changing the mean, while keeping everything else constant, shifts the curve to the left or to the right.
Mean Increases